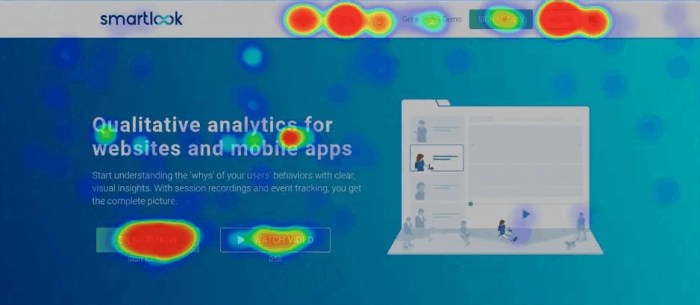
Understanding Website Heatmaps dives into the fascinating world of visual data analysis, shedding light on how businesses can leverage heatmaps to enhance user experience and optimize website performance.
From deciphering different heatmap types to interpreting actionable insights, this discussion will equip you with the knowledge needed to harness the power of heatmaps effectively.
Introduction to Website Heatmaps
Website heatmaps are visual tools that display where users interact with a website by using color-coded data overlays. These heatmaps can provide valuable insights into user behavior, allowing website owners to optimize their site for better user experience and increased conversions.Using website heatmaps can help website owners understand how users navigate through their site, which areas attract the most attention, and where users may be getting confused or stuck.
By analyzing this data, website owners can make informed decisions to improve the layout, content, and functionality of their website.
Benefits of Using Website Heatmaps
- Identifying popular areas on a webpage: Heatmaps can show which sections of a webpage are getting the most clicks or attention from users, helping website owners prioritize content placement.
- Tracking user scrolling behavior: Scroll heatmaps can reveal how far users scroll down a page before losing interest, indicating where important information should be placed.
- Discovering areas of high and low engagement: Click heatmaps can highlight areas where users interact the most (or least) with a webpage, guiding website owners in optimizing their design and content.
- Improving call-to-action placement: Heatmaps can show whether users are clicking on call-to-action buttons as intended, allowing for adjustments to increase conversions.
Types of Website Heatmaps
Website heatmaps come in various types, each providing unique insights into user behavior on a website. Let’s explore the different types and how they can be used for analysis.
Yo, if you’re new to the whole meditation scene and looking to get started, check out this dope guide on Meditation for Beginners. It’s all about finding your inner peace and getting that zen vibe going. Trust me, it’s worth a shot!
Click Heatmaps
Click heatmaps track where users click on a webpage, showing hotspots of user activity. This type of heatmap is useful for identifying popular areas of a page and optimizing the placement of important elements such as buttons or links.
Scroll Heatmaps
Scroll heatmaps display how far down a page users scroll before leaving. They help determine the effectiveness of content placement and whether users are engaging with the entire page or dropping off before reaching key information.
Move Heatmaps
Move heatmaps track the movement of the mouse cursor on a webpage, highlighting areas of interest or confusion. These heatmaps can reveal user attention patterns and potential areas for improvement in design or content layout.
Attention Heatmaps
Attention heatmaps show where users focus their attention on a page, based on factors like mouse movement and dwell time. By analyzing these heatmaps, you can optimize the visibility of important elements and enhance user engagement.Each type of heatmap provides valuable insights into user behavior and interaction with a website, helping businesses make data-driven decisions for improvement and optimization.
Understanding Heatmap Data: Understanding Website Heatmaps

Heatmap data is collected by tracking user interactions on a website and visualizing it in a graphical format to identify patterns and trends. This data is represented using colors to indicate the intensity of user activity on different parts of a webpage.
Hey, have you ever thought about trying meditation? If you’re a beginner and not sure where to start, check out this awesome guide on Meditation for Beginners. It’s super helpful and perfect for getting into the groove of mindfulness. Give it a shot and see how it can bring some zen into your hectic high school life!
Common Metrics in Heatmap Analysis
- Click-through rates: Measure the percentage of visitors who click on a specific element like a button or link.
- Scroll depth: Indicates how far visitors scroll down a webpage before leaving.
- Hotspots: Highlight areas of a page where users spend the most time or interact the most.
Interpreting heatmap data involves looking for trends, anomalies, and areas of improvement to enhance user experience and optimize website performance.
Implementing Heatmaps on Websites

Implementing heatmaps on websites can provide valuable insights into user behavior and interactions. By following the steps to integrate heatmap tools on a website, setting up best practices, and optimizing heatmap settings, you can ensure accurate data collection to improve user experience and overall website performance.
Integrating Heatmap Tools
To integrate heatmap tools on your website, follow these steps:
- Choose a reliable heatmap tool provider that suits your website’s needs and budget.
- Sign up for an account and generate a tracking code or plugin for your website.
- Insert the tracking code or install the plugin on your website’s backend or content management system.
- Configure the heatmap settings to track specific user interactions, such as clicks, scrolls, and mouse movements.
- Verify that the heatmap tool is working correctly by testing different pages and elements on your website.
Setting Up Best Practices
When setting up and configuring heatmaps, consider the following best practices:
- Focus on tracking key performance indicators (KPIs) related to user engagement and conversion goals.
- Ensure that the heatmap tool is compatible with different devices and browsers to capture a wide range of user interactions.
- Regularly review and analyze heatmap data to identify patterns, trends, and areas for improvement on your website.
- Collaborate with your team to interpret heatmap data and implement changes based on user behavior insights.
Optimizing Heatmap Settings, Understanding Website Heatmaps
To optimize heatmap settings for accurate data collection, keep the following tips in mind:
- Adjust the sensitivity and sample rate of the heatmap tool to capture detailed user interactions without overwhelming data.
- Filter out irrelevant data points and focus on meaningful insights that align with your website’s goals and objectives.
- Periodically update heatmap configurations based on changes to your website’s layout, content, or functionality.
- Experiment with different heatmap settings to find the most effective configuration for tracking user behavior and improving website performance.
Interpreting Heatmap Results
When it comes to analyzing heatmap results, it’s essential to pay attention to the areas of high user interaction, indicated by warmer colors, such as red and orange. These areas typically represent the most engaging parts of a webpage, where users are spending more time or interacting with elements. On the other hand, cooler colors like blue or green signify areas with low interaction, which may indicate that users are not engaging as much with those elements.
Common Patterns and Trends in Heatmap Visualizations
- Hotspots: Look for clusters of red or orange areas, as they indicate the most popular sections of a webpage that are attracting user attention.
- F-shaped Pattern: This common reading pattern shows that users tend to scan a webpage in an F-shaped manner, focusing on the top and left side more than the bottom and right side.
- Click Density: Pay attention to areas with high click density, as they show where users are clicking the most, which can help prioritize important elements.
Businesses Enhancing User Experience with Heatmap Data
- An e-commerce website used heatmap data to identify that users were not scrolling down to view product details. By moving key information higher on the page, they increased conversions.
- A news website analyzed heatmap results to discover that users were not clicking on recommended articles. They adjusted the placement and visibility of recommendations, leading to higher engagement.
- A SaaS company found through heatmaps that users were trying to click non-clickable elements. They made those elements interactive, improving user satisfaction and reducing frustration.
